India’s most industrialised state, Maharashtra, has the largest debt of Rs 338,730 crore ($51 billion) among India’s states, but the southern state of Tamil Nadu—an industrial growth centre—has seen the maximum increase in debt (92%) over the past five years.
There are two ways of looking at this indebtedness: it is funding a humming state economy or is indicative of a profligate government living beyond its means.
Debt is often used by governments to meet the gap between income and expenditure. Government borrows either to meet plan expenditure, for example, building roads and dams and non-plan expenditure, such as paying salaries or making interest payments.
While plan expenditure is more productive and leads to further revenue, debt created for non-plan expenditure is unproductive.
Debt Of Major States, FY 2010 – 2015
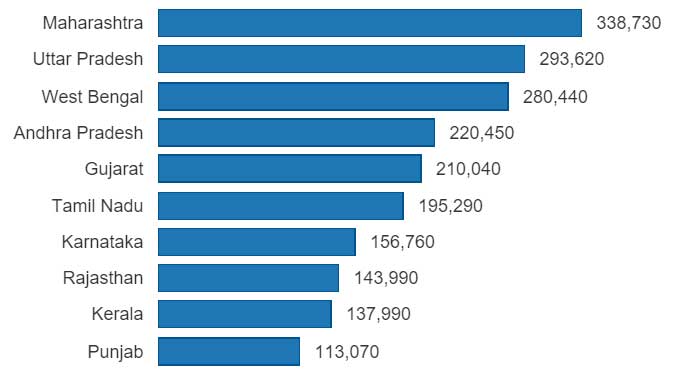
The debt for all major states has increased 66% over the past five years from Rs 16,48,650 crore ($358 billion) in 2010 to Rs 27,33,630 crore ($414 billion) in 2015.
Maharashtra with the highest outstanding liabilities is followed by Uttar Pradesh with Rs 2,93,620 crore ($44 billion) and West Bengal with Rs 2,80,440 crore ($42 billion).
Tamil Nadu has borrowed money at the quickest annual pace, 92%, followed by Karnataka with 85% and Andhra Pradesh with 78%.
Average Debt Per Capita, Maharashtra & Tamil Nadu

Debt not bad if economic growth follows
Debt, per se, is not bad, if the state’s economic growth can sustain and service it. So, the key matrix to check is the debt as a percentage of the state’s gross domestic product (GSDP) or total economic output.
States With Highest Debt To GSDP Ratio
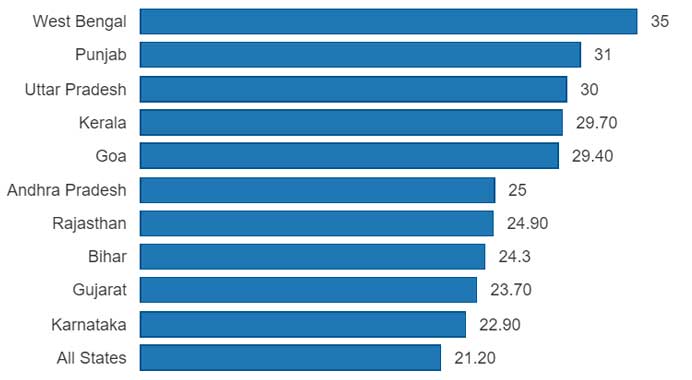
West Bengal, Punjab and Uttar Pradesh have the highest debt-to-GSDP ratios.
The good news over the past five years is that the debt-to-GSDP ratio for all the states has come down from 25.5% to 21.2%.
In West Bengal, despite the increase in outstanding liabilities, the debt-to-GSDP ratio has declined, which means the state’s GDP is growing at a fast clip.
That cannot be said for Andhra Pradesh. The state has seen a 78% increase in outstanding liabilities but its debt-to-GSDP ratio is constant at 25%. The debt-to-GSDP ratio was lowest in 2012 at 22.5%.
Maharashtra has the highest outstanding liabilities but does not feature among the top 10 states with high debt-to-GSDP ratio. The debt-to-GSDP ratio for Maharashtra at 20.2% is lower than the national average of 21.2%.
Similarly, although Tamil Nadu is fast adding debt, its debt-to-GSDP ratio at 20% is lower than the national average. This shows that the state’s GSDP is growing despite the high growth in debt.
With debt comes interest
Once you borrow, you have to pay back with interest. Most states service debt from tax income. And a good measure of debt servicing is a lower ratio as a percentage of revenue expenditure.
Most states have seen a decline in interest payments, except Tamil Nadu which has seen an increase from 10.5% in 2012-13 to 11.6% in 2014-15.
States With Highest Interest Payments
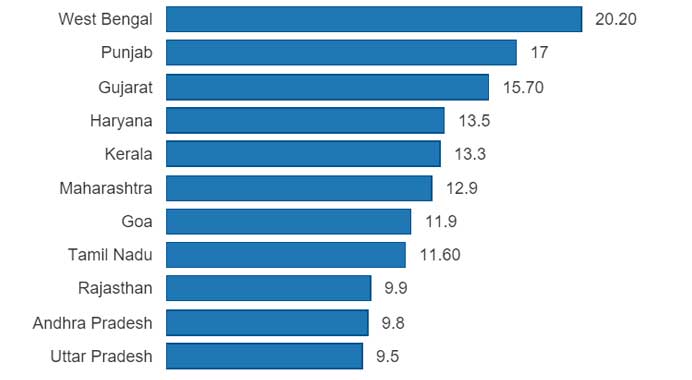
The trend remains unchanged in 2014-2015 with the three states retaining the top spots. However, the encouraging sign is that there has been a reduction in interest payments as a percentage of revenue expenditure for all three states.
Courtesy : indiaspend


